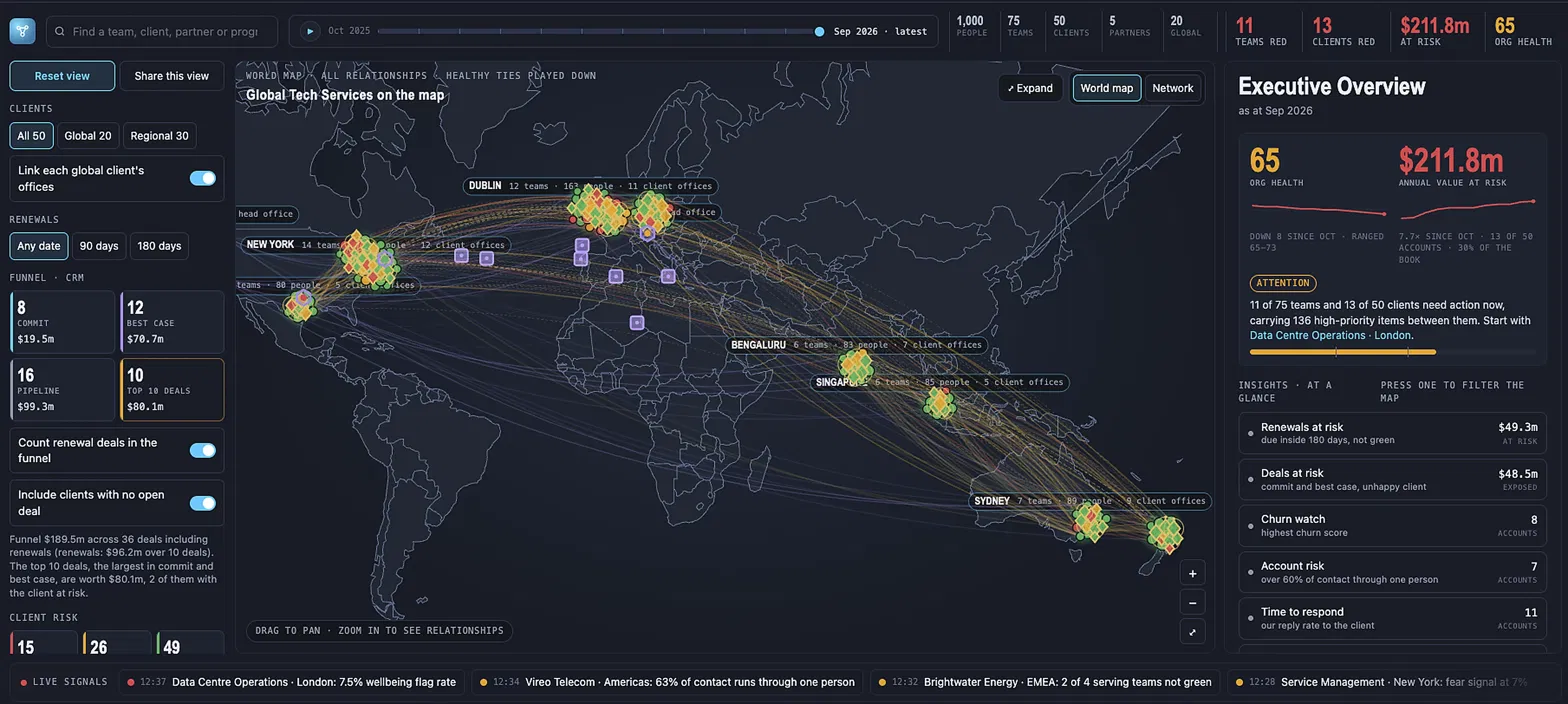
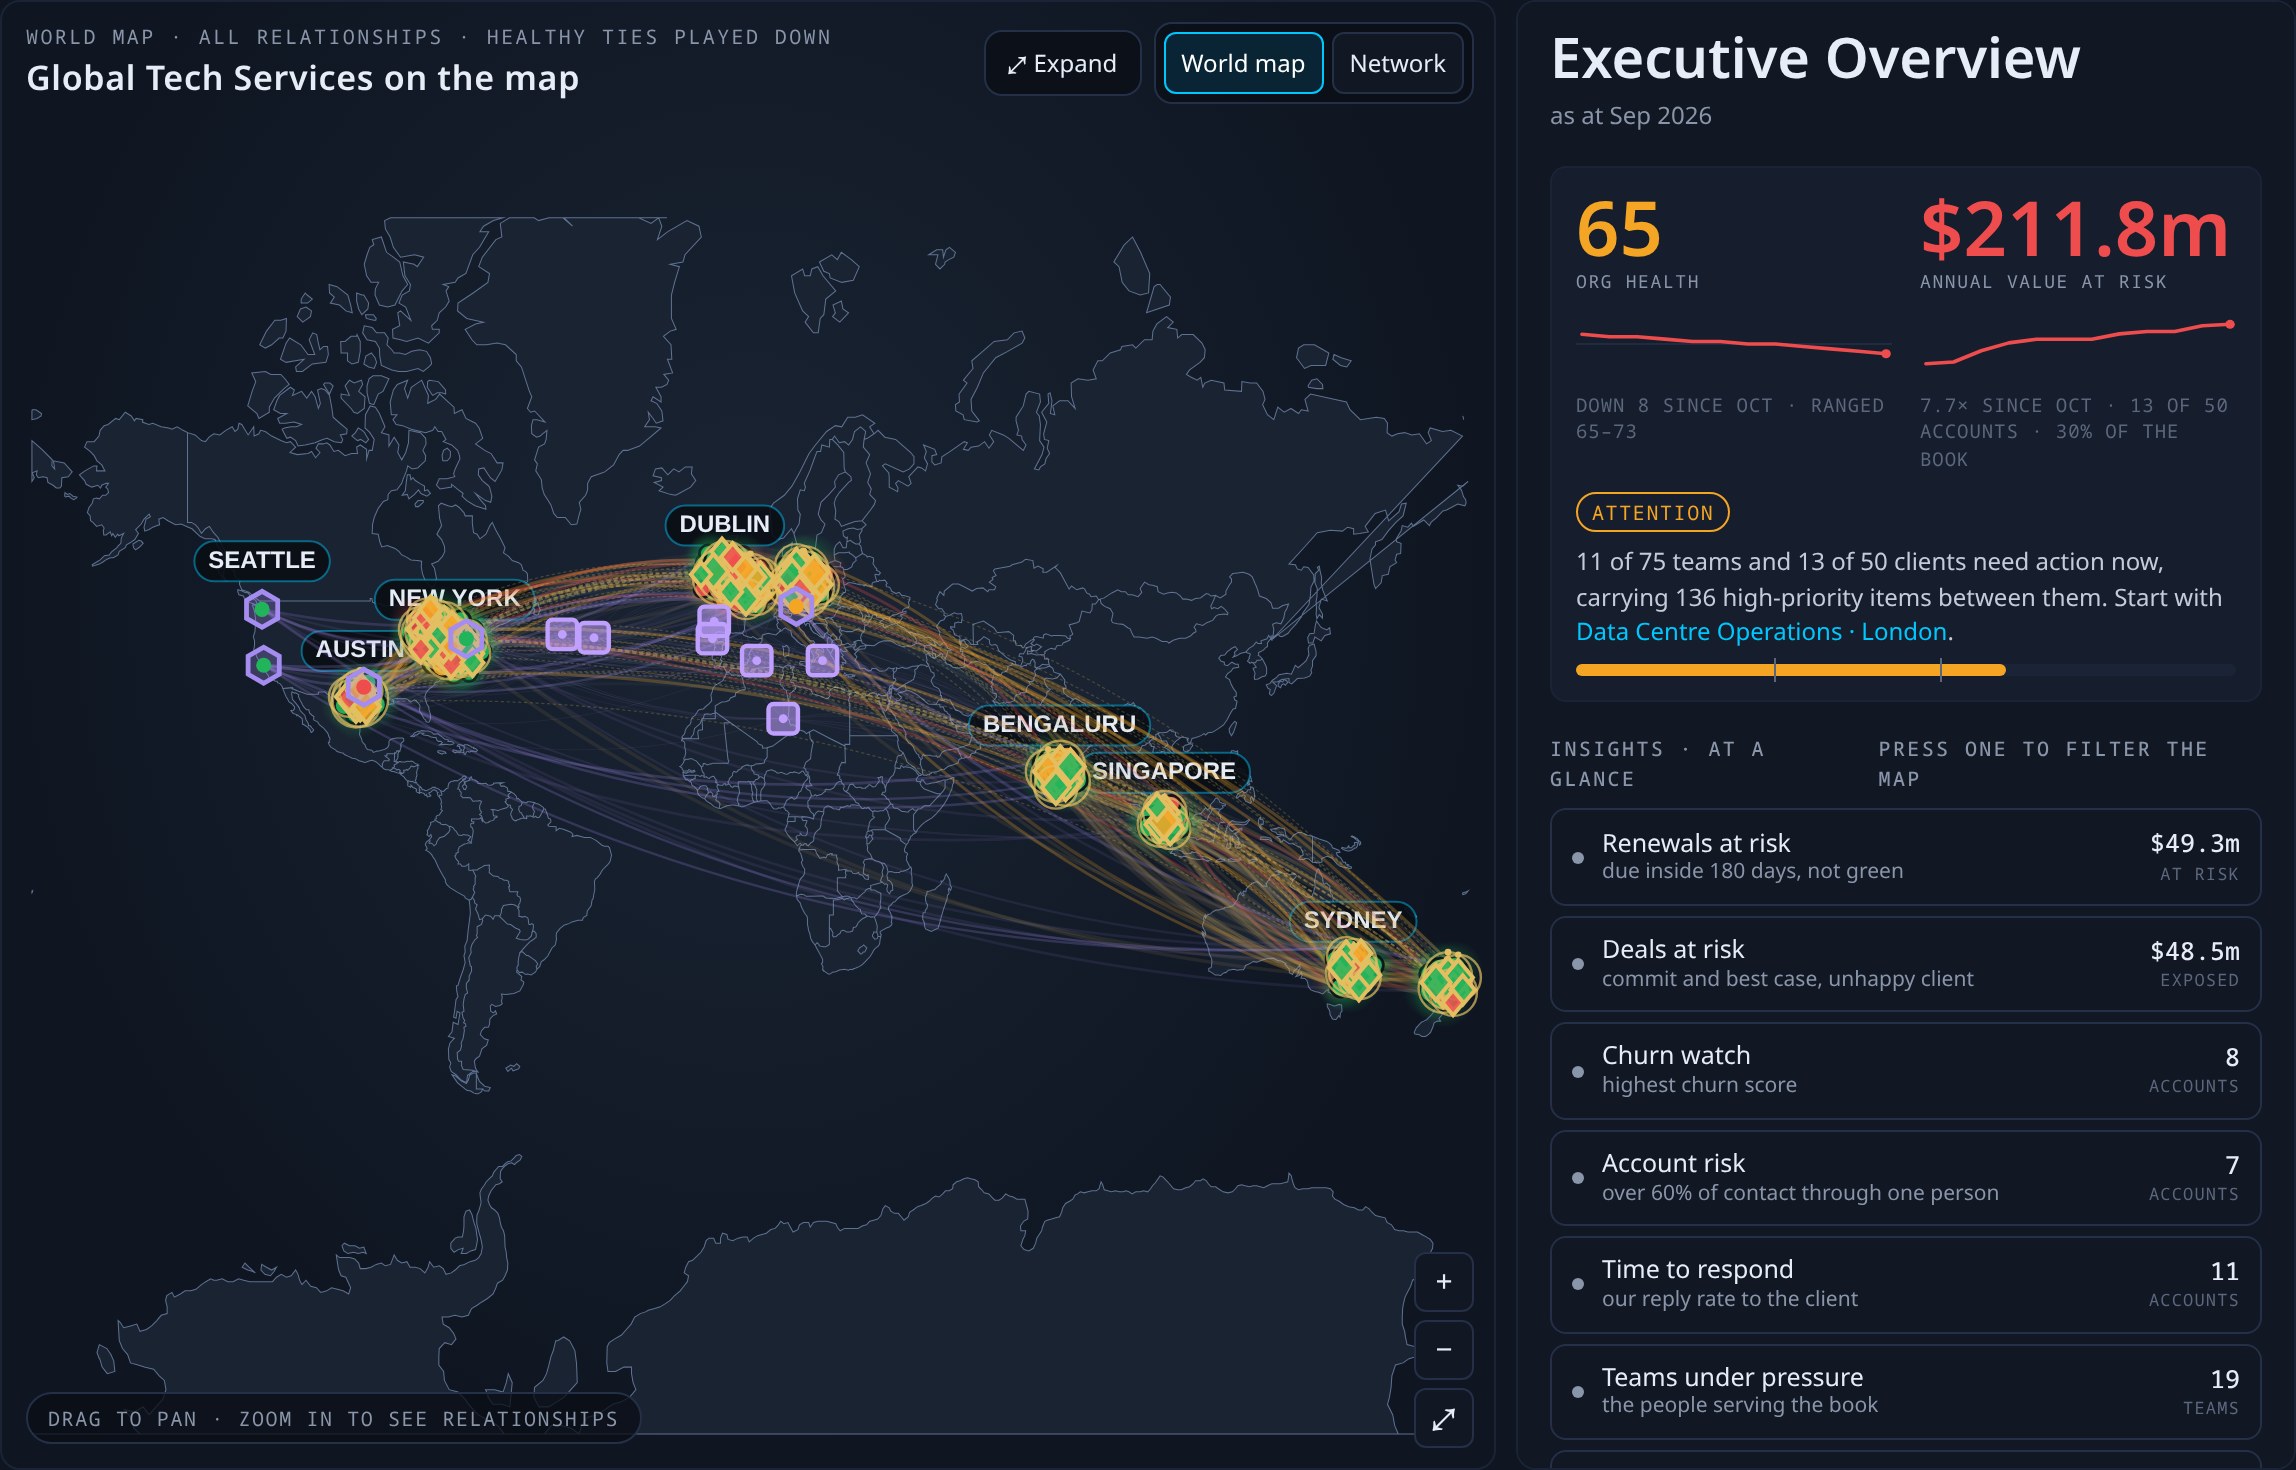
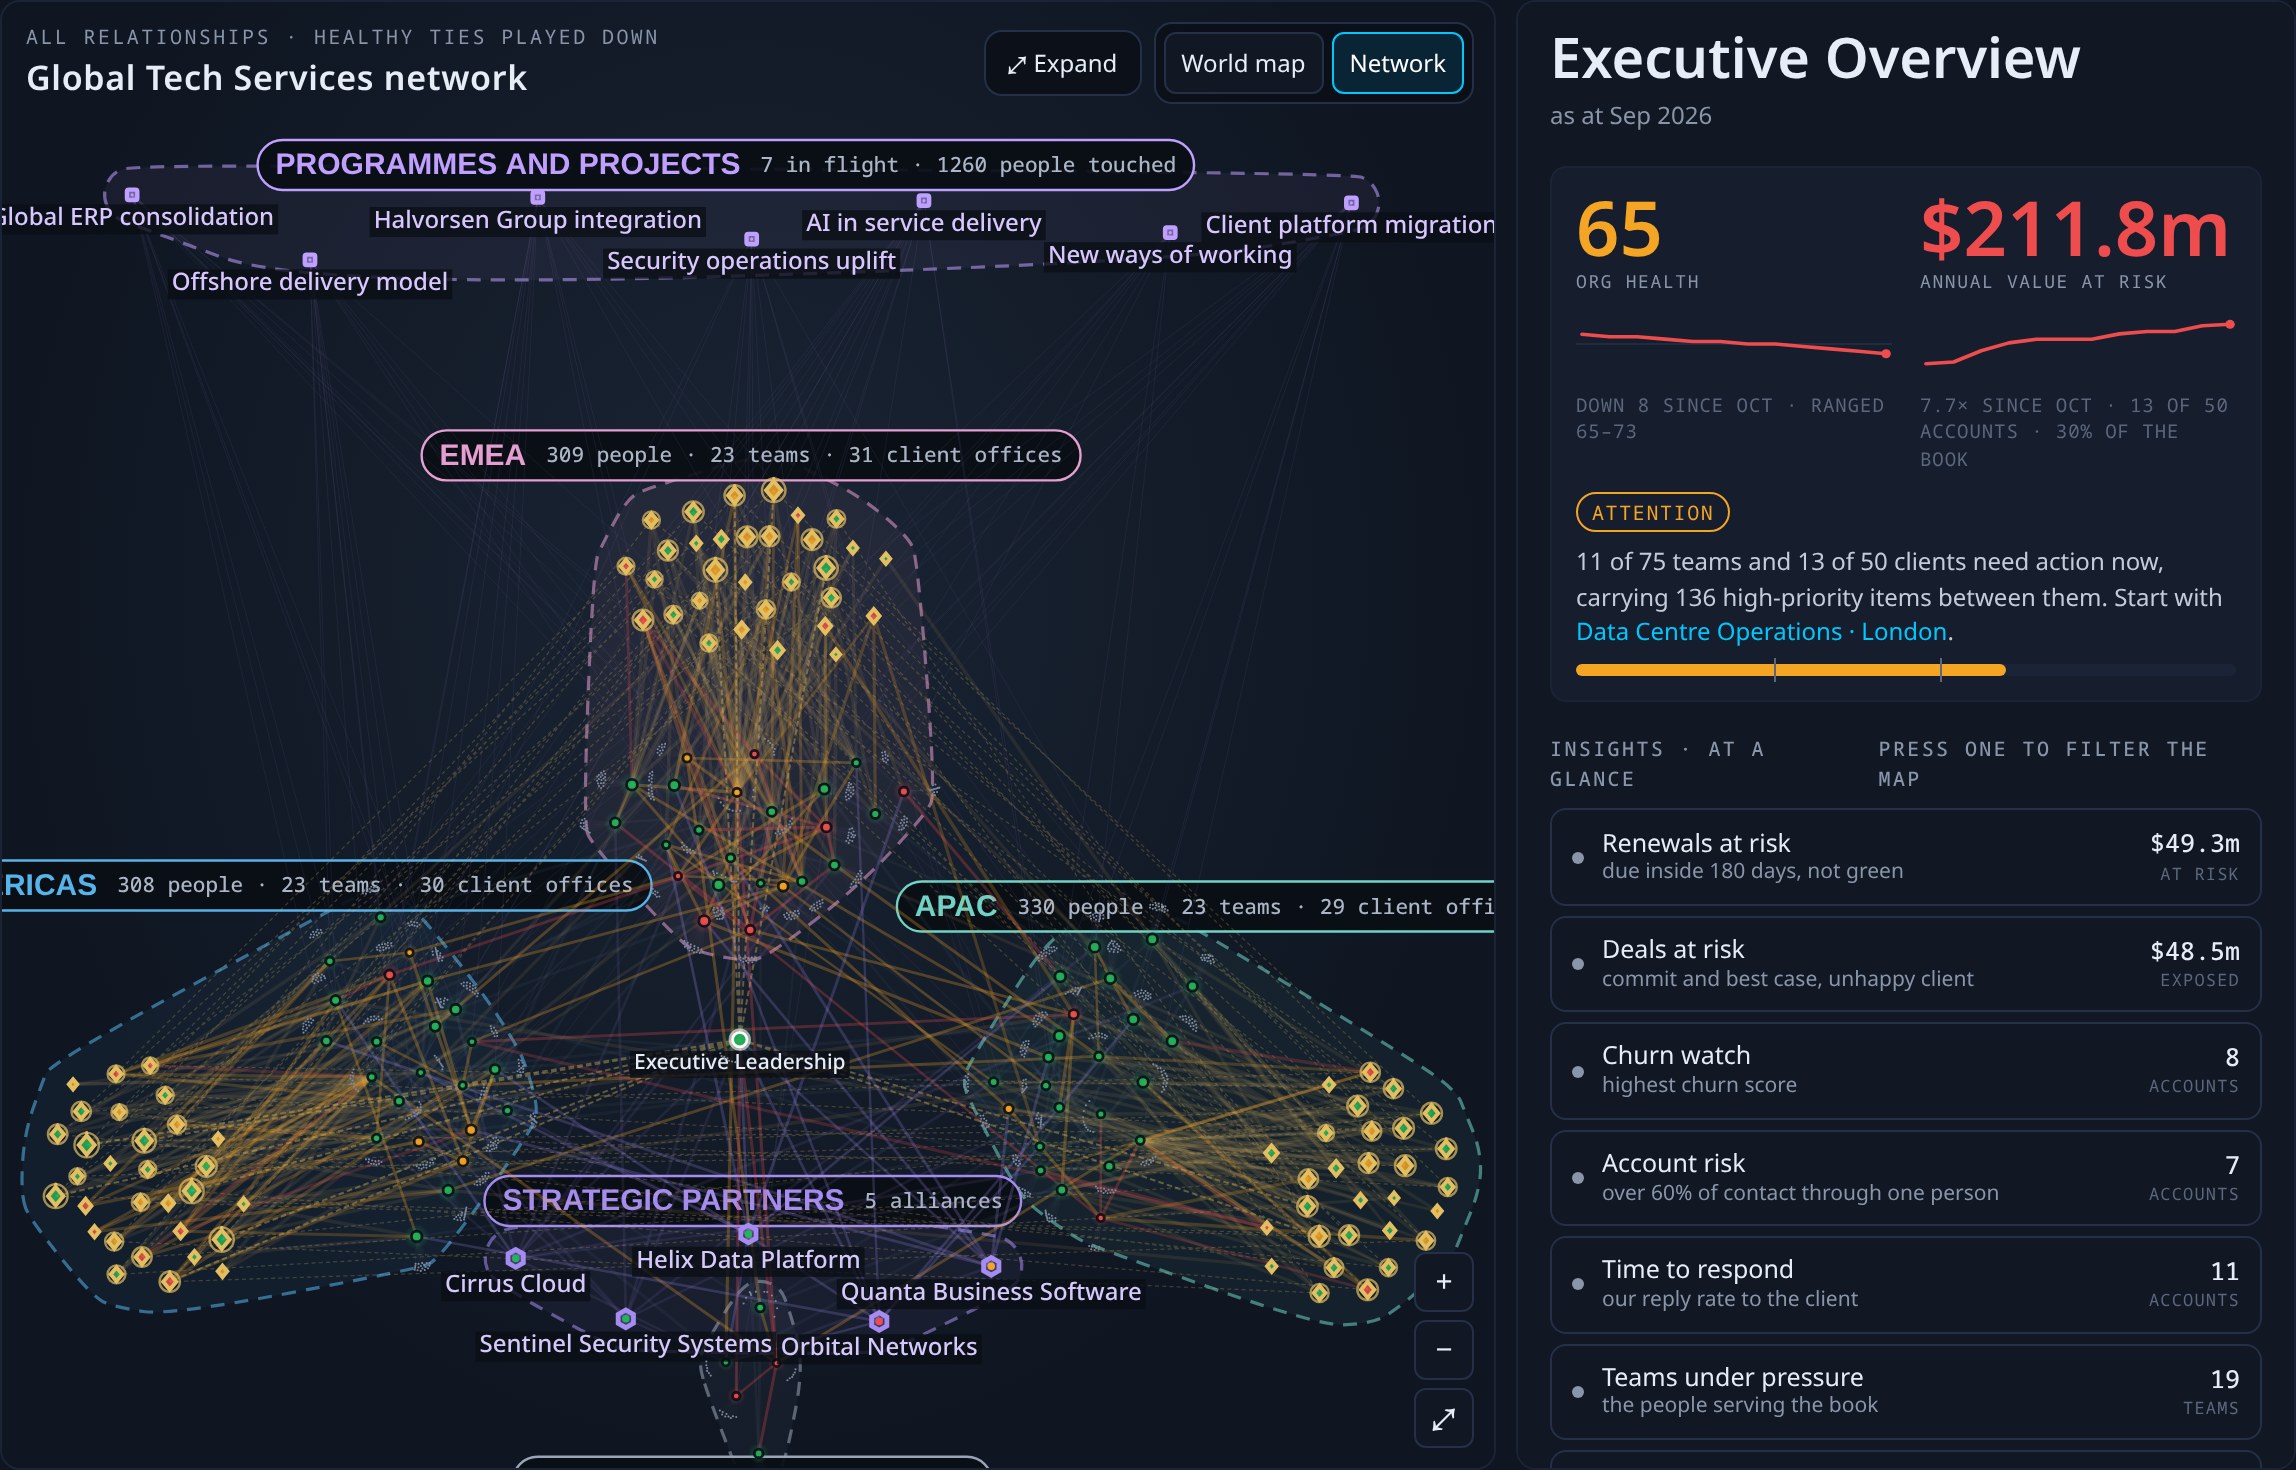
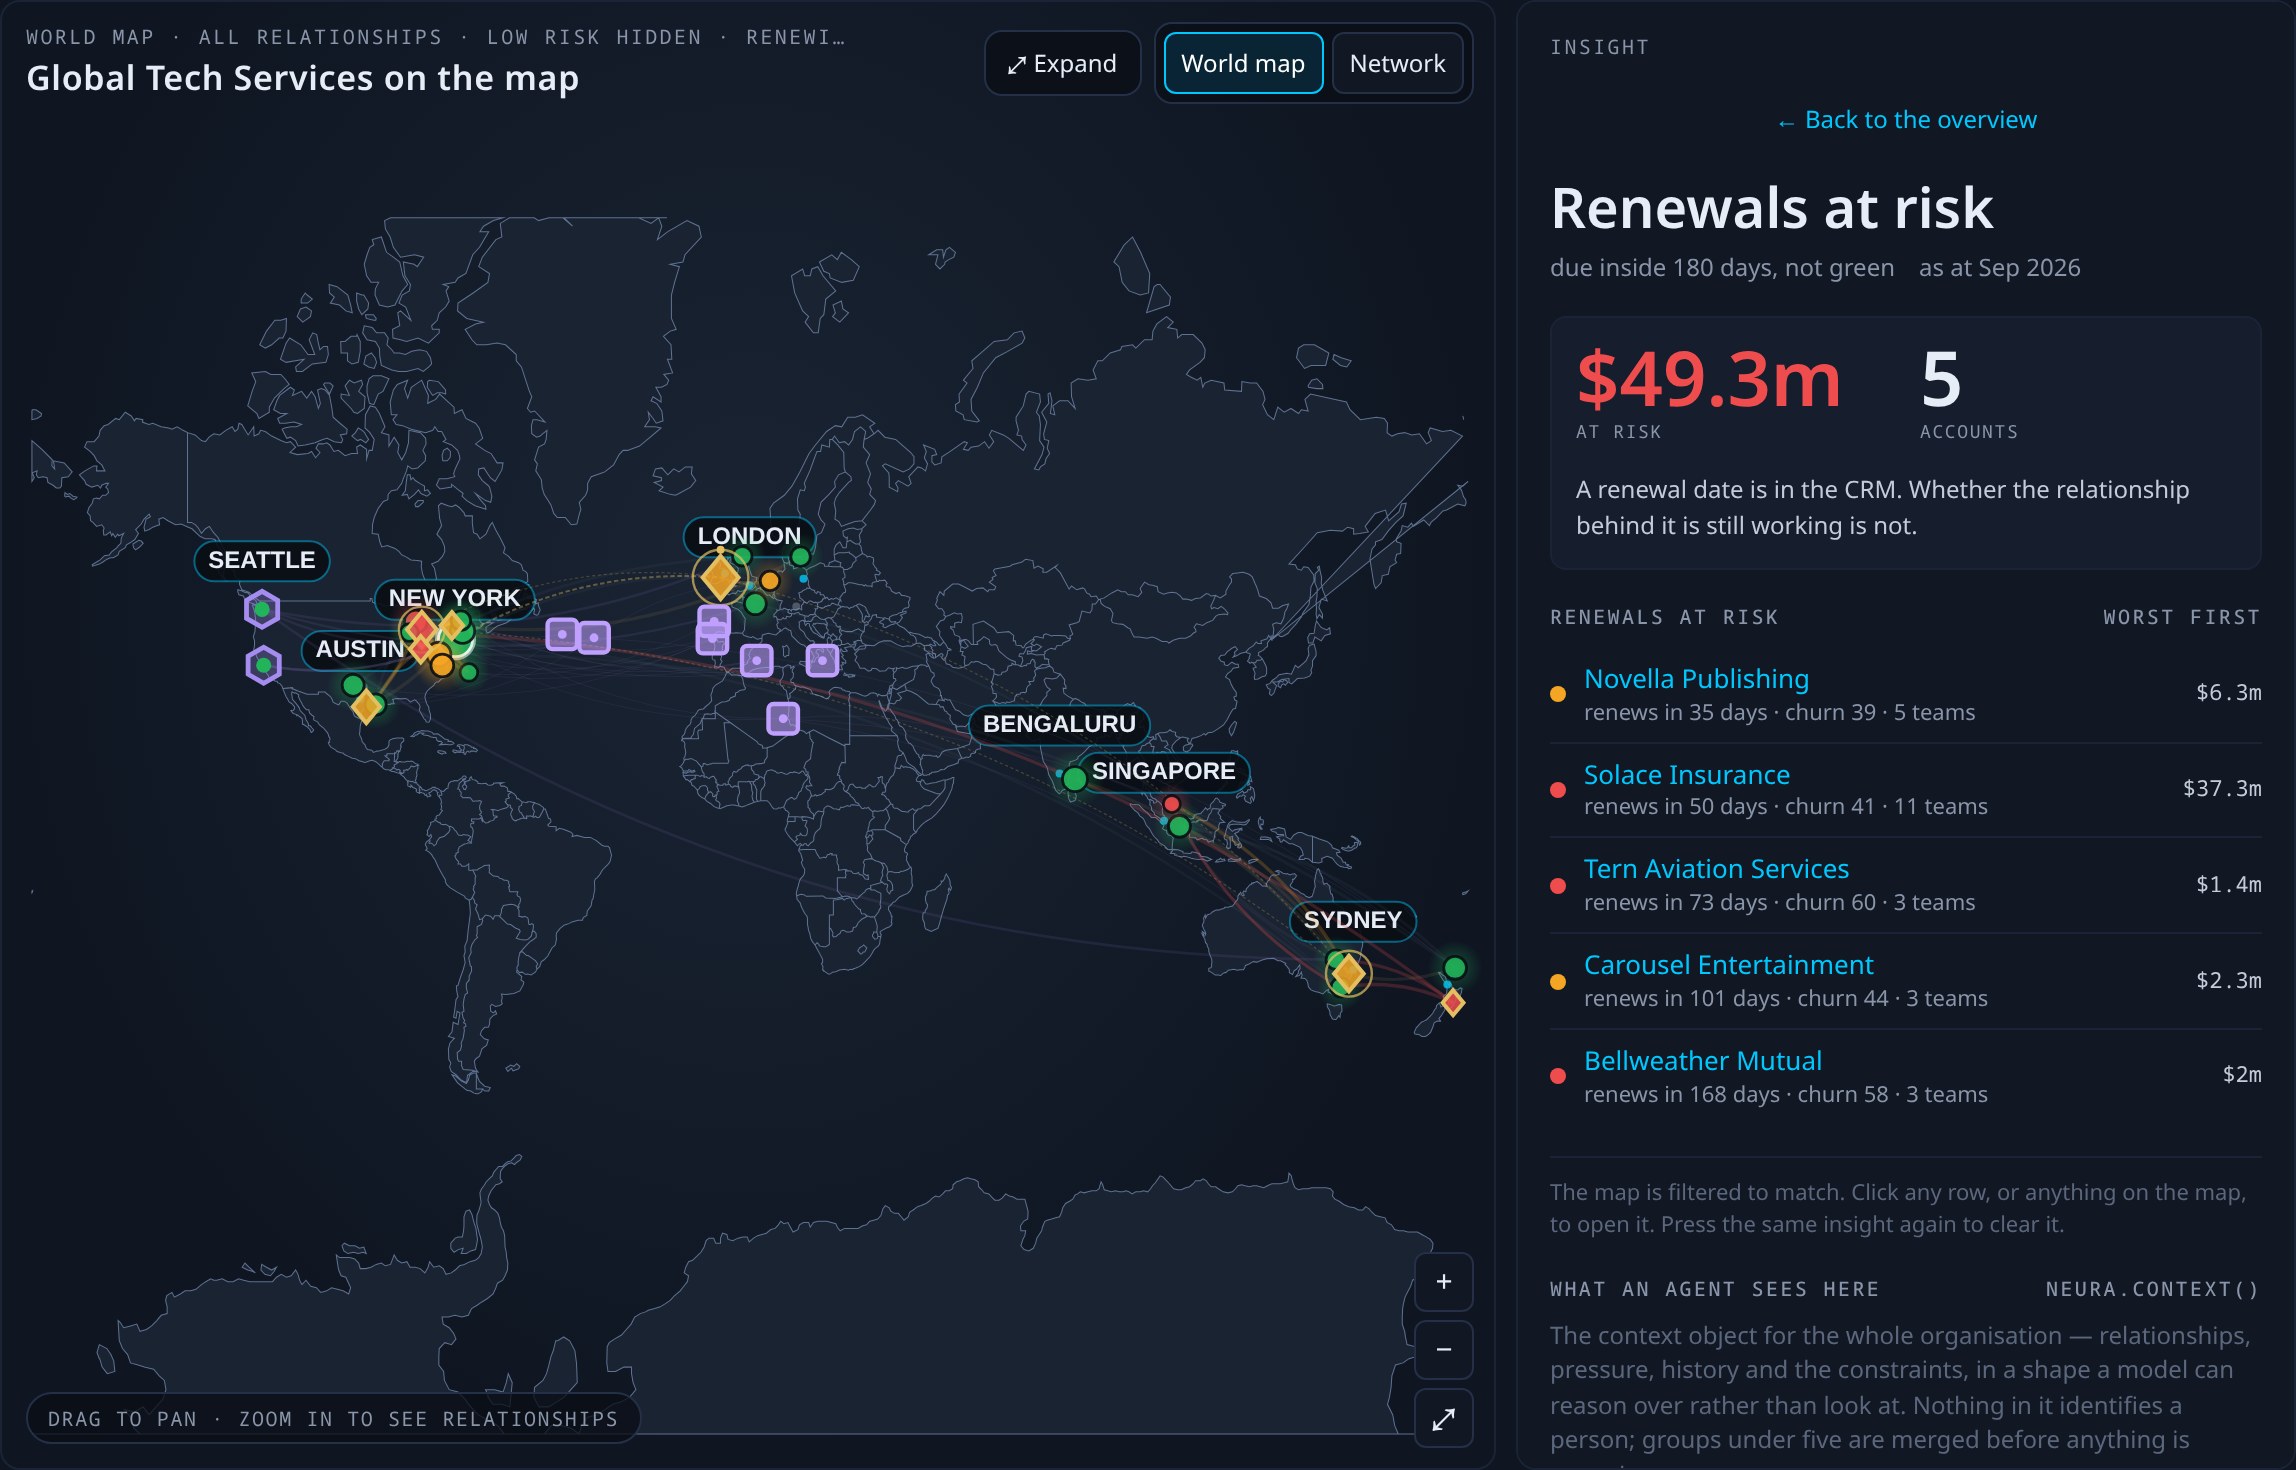
Global Tech Services
Fifty clients and seventy-five teams, with revenue at risk surfaced ahead of the renewal.
Open the demoFor leaders of complex organizations
Afinico shows leaders where revenue, profit and enterprise value are at risk in their client relationships, acquisitions and programs, months before it shows in performance reporting.
The problem
By the time a weakening client, a stalling integration or a failing program shows up in reporting, most of the value is already gone.
Poor client relationships hit pipeline, revenue and EBITDA.
Illustrative example
A $1B firm earns 40% of revenue from 20 clients. Losing one it didn't see slipping costs $10M–$20M in revenue and $25M–$50M in enterprise value.
What Afinico shows you
Which major clients are drifting, and why, months before the renewal.
Struggling M&A integrations destroy enterprise value.
Illustrative example
A $500M acquisition. A leadership problem found a year late can wipe $25M–$50M off enterprise value of a portfolio company.
What Afinico shows you
Whether the combined leadership and teams are working together in the first 100 days, not a year later.
Poor coordination derails large capital programs.
Illustrative example
A $2B program. A 5%–10% overrun from poor coordination costs $100M–$200M, before the cost of delay.
What Afinico shows you
Where coordination between teams and contractors is breaking down, before the milestone slips.
What Afinico does
Afinico Neura
Afinico Neura is the software that does this. It shows how your teams, clients, partners and portfolio companies are working together, and gives that picture to your leaders and the AI agents they use.
Explore Afinico Neura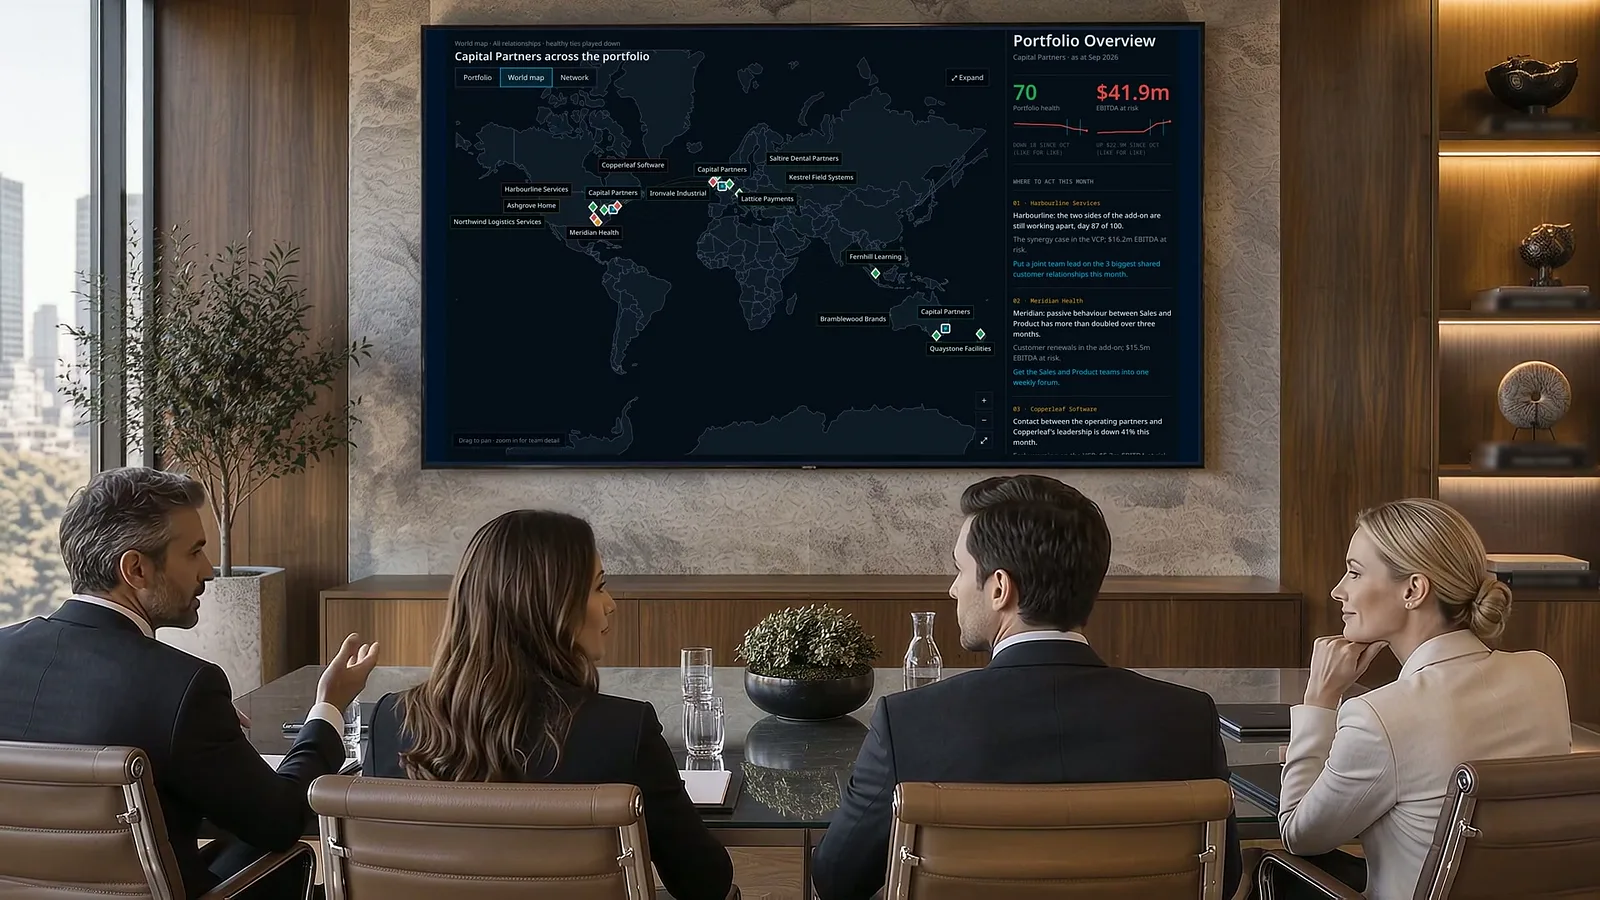
Built first for large technology and services firms whose revenue rests on major client relationships, and the private capital owners who hold them. The same platform applies to defense and government.
Seeing performance risk earlier
Client relationships, delivery across teams and markets, and the commercial performance that depends on both.
Seeing value at risk earlier
Integrations, leadership teams and client relationships across the portfolio.
Seeing coordination risk earlier
Situational awareness, planning and decision support across units, partners and industry.
Seeing delivery risk earlier
Policy reaching the front line, coordination between agencies, and the services the public receives.
Three demonstration environments show Afinico Neura in use. The organizations are invented and all data is synthetic.
Fifty clients and seventy-five teams, with revenue at risk surfaced ahead of the renewal.
Open the demo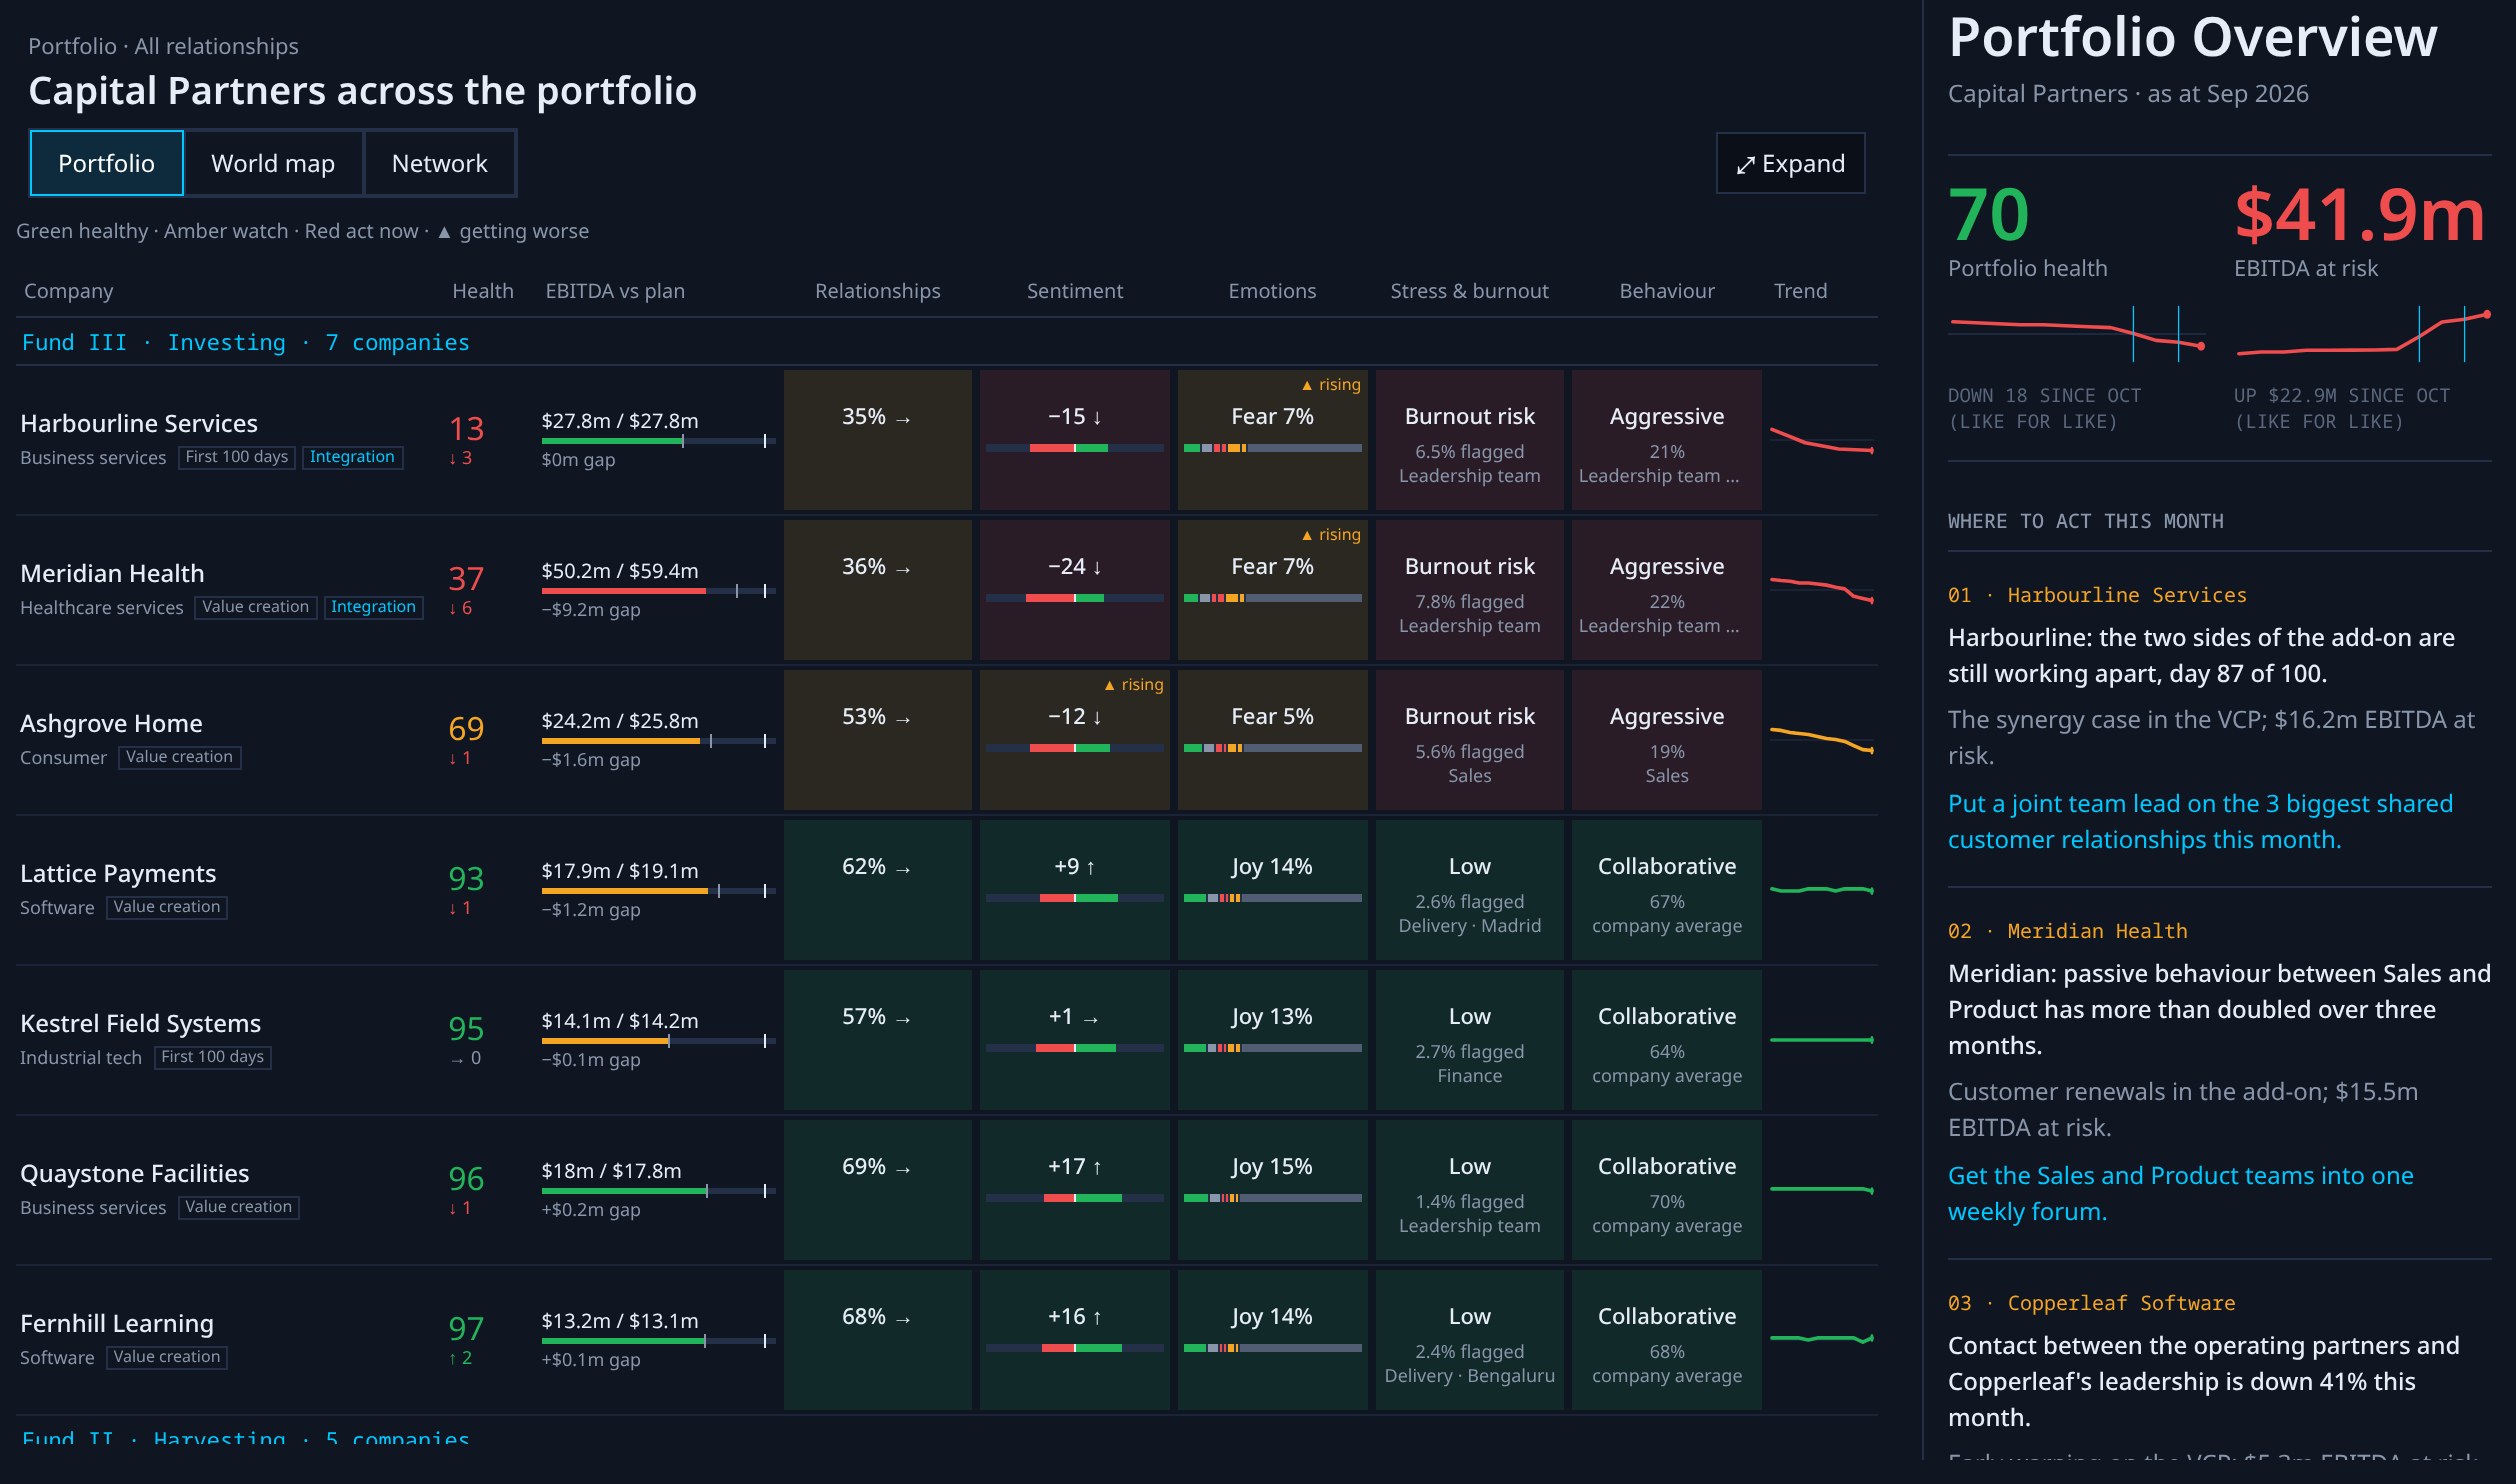
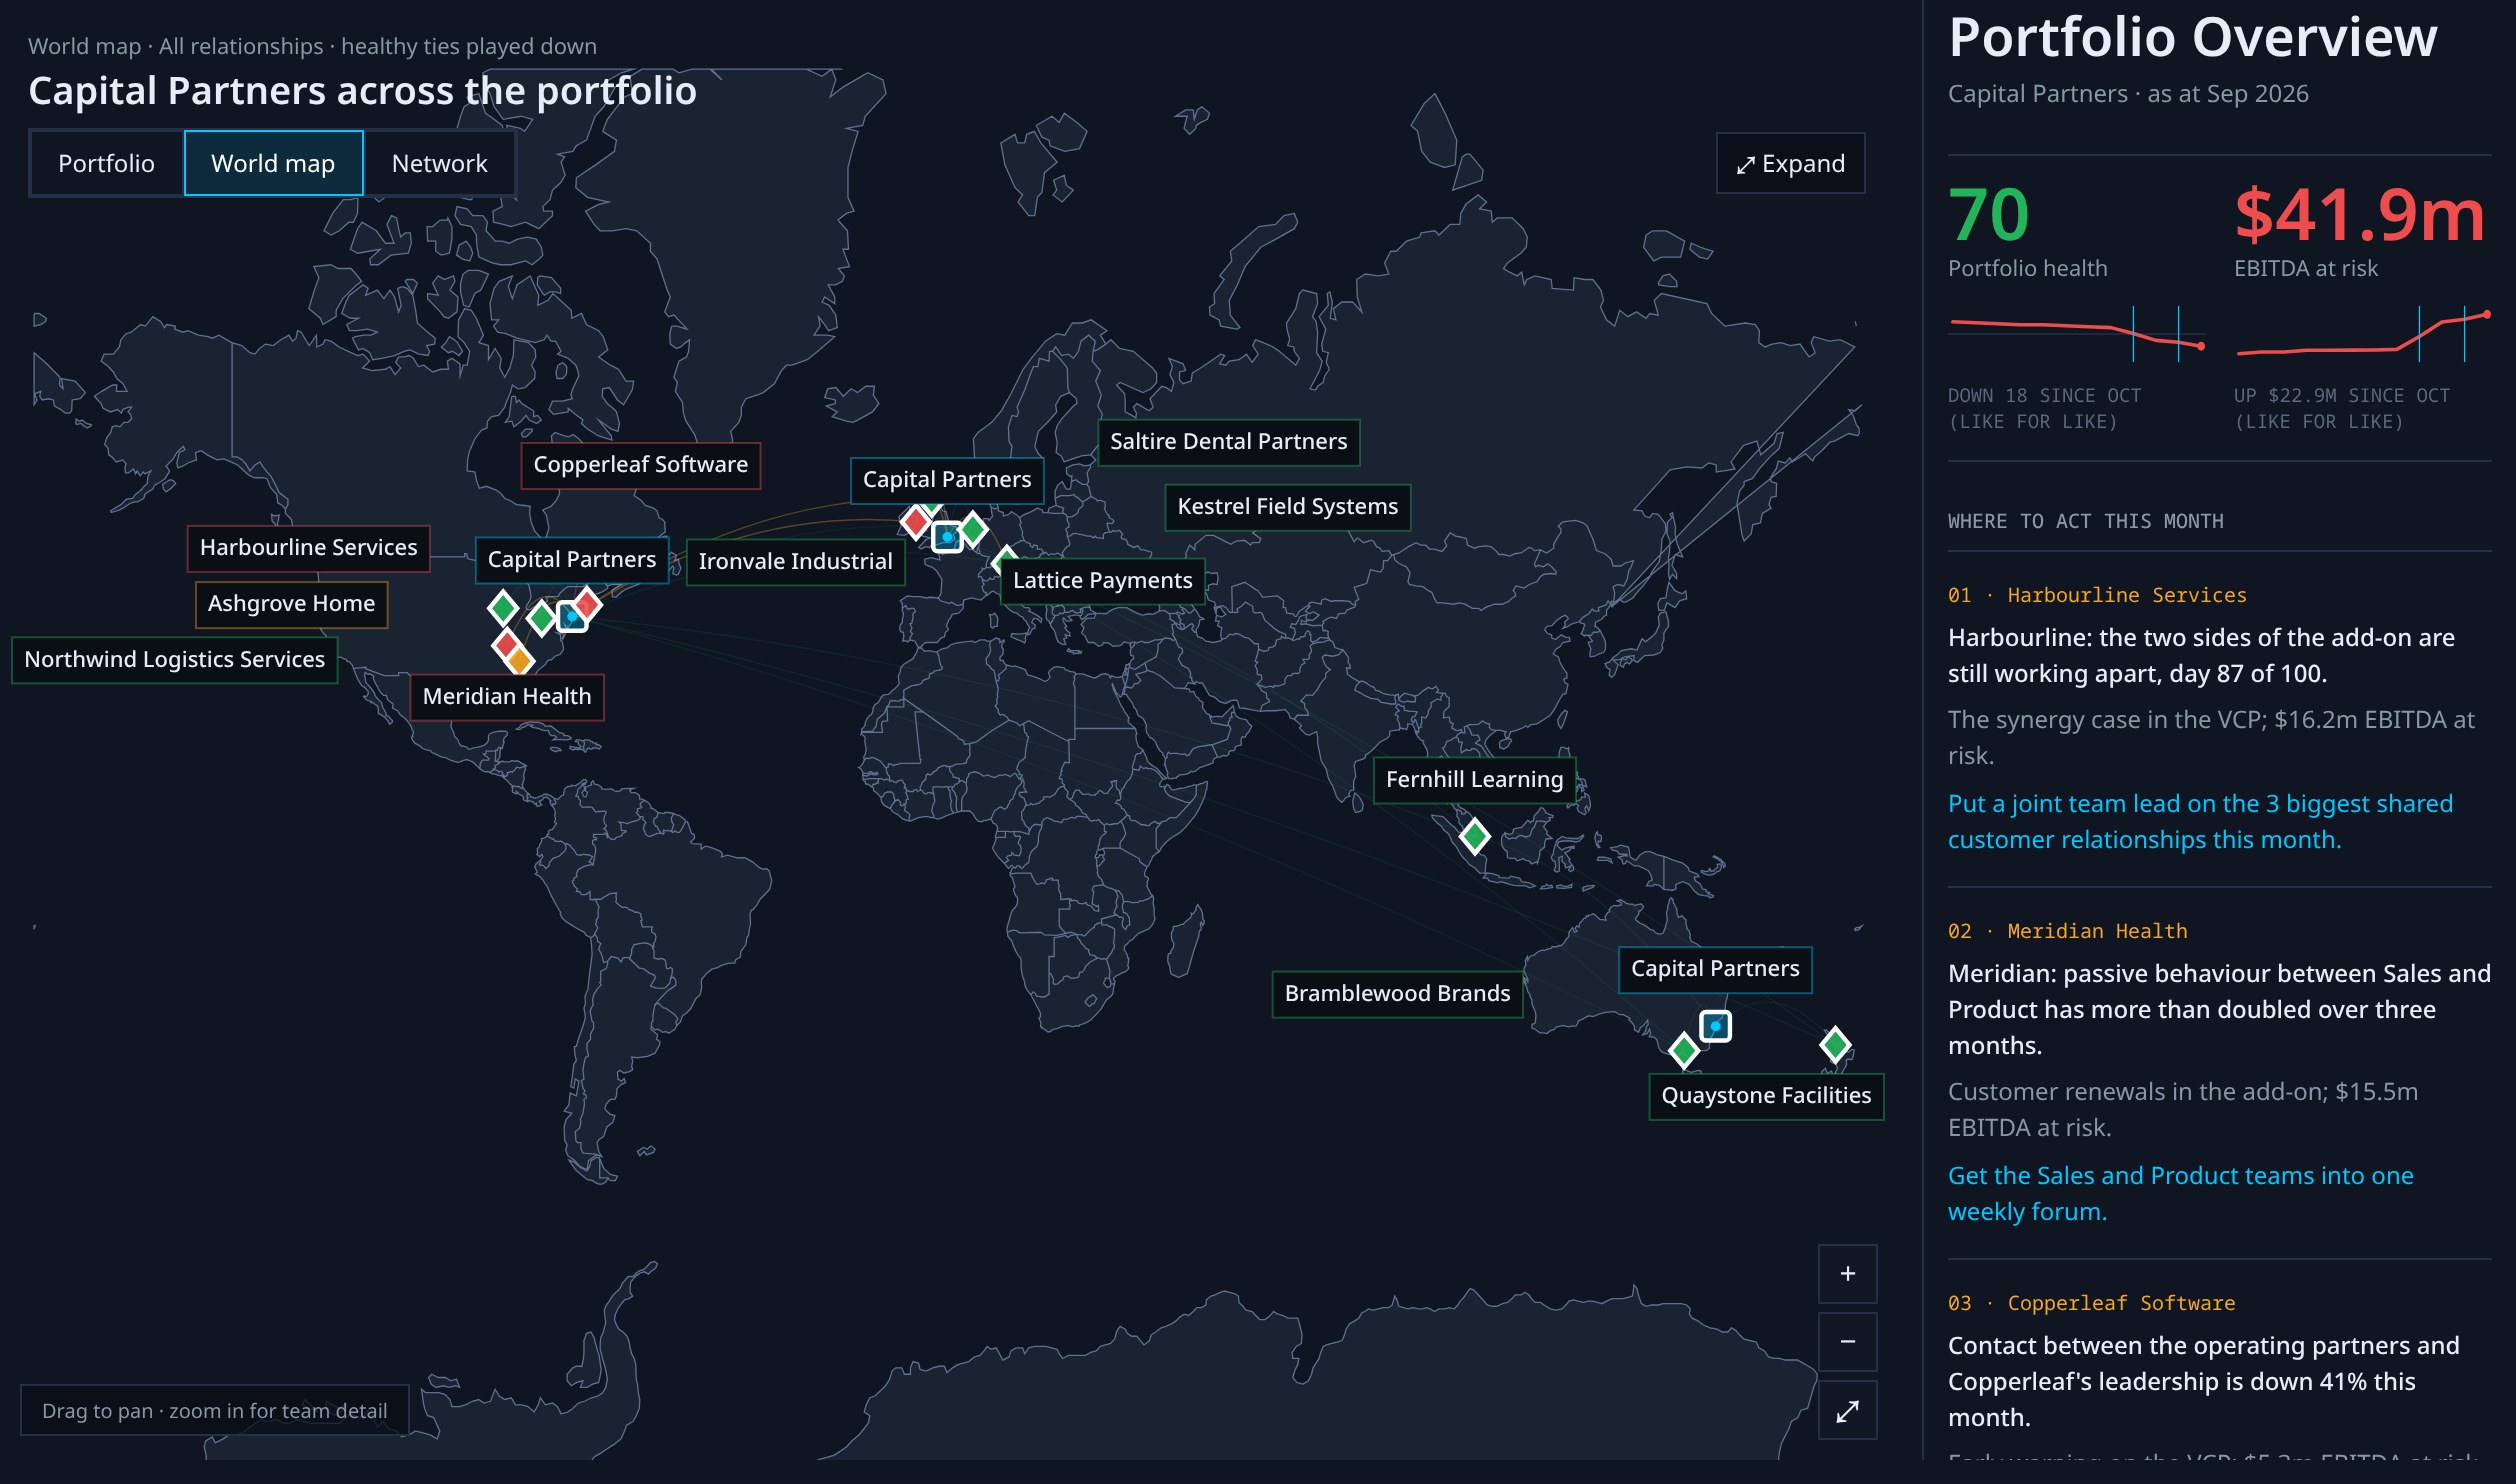
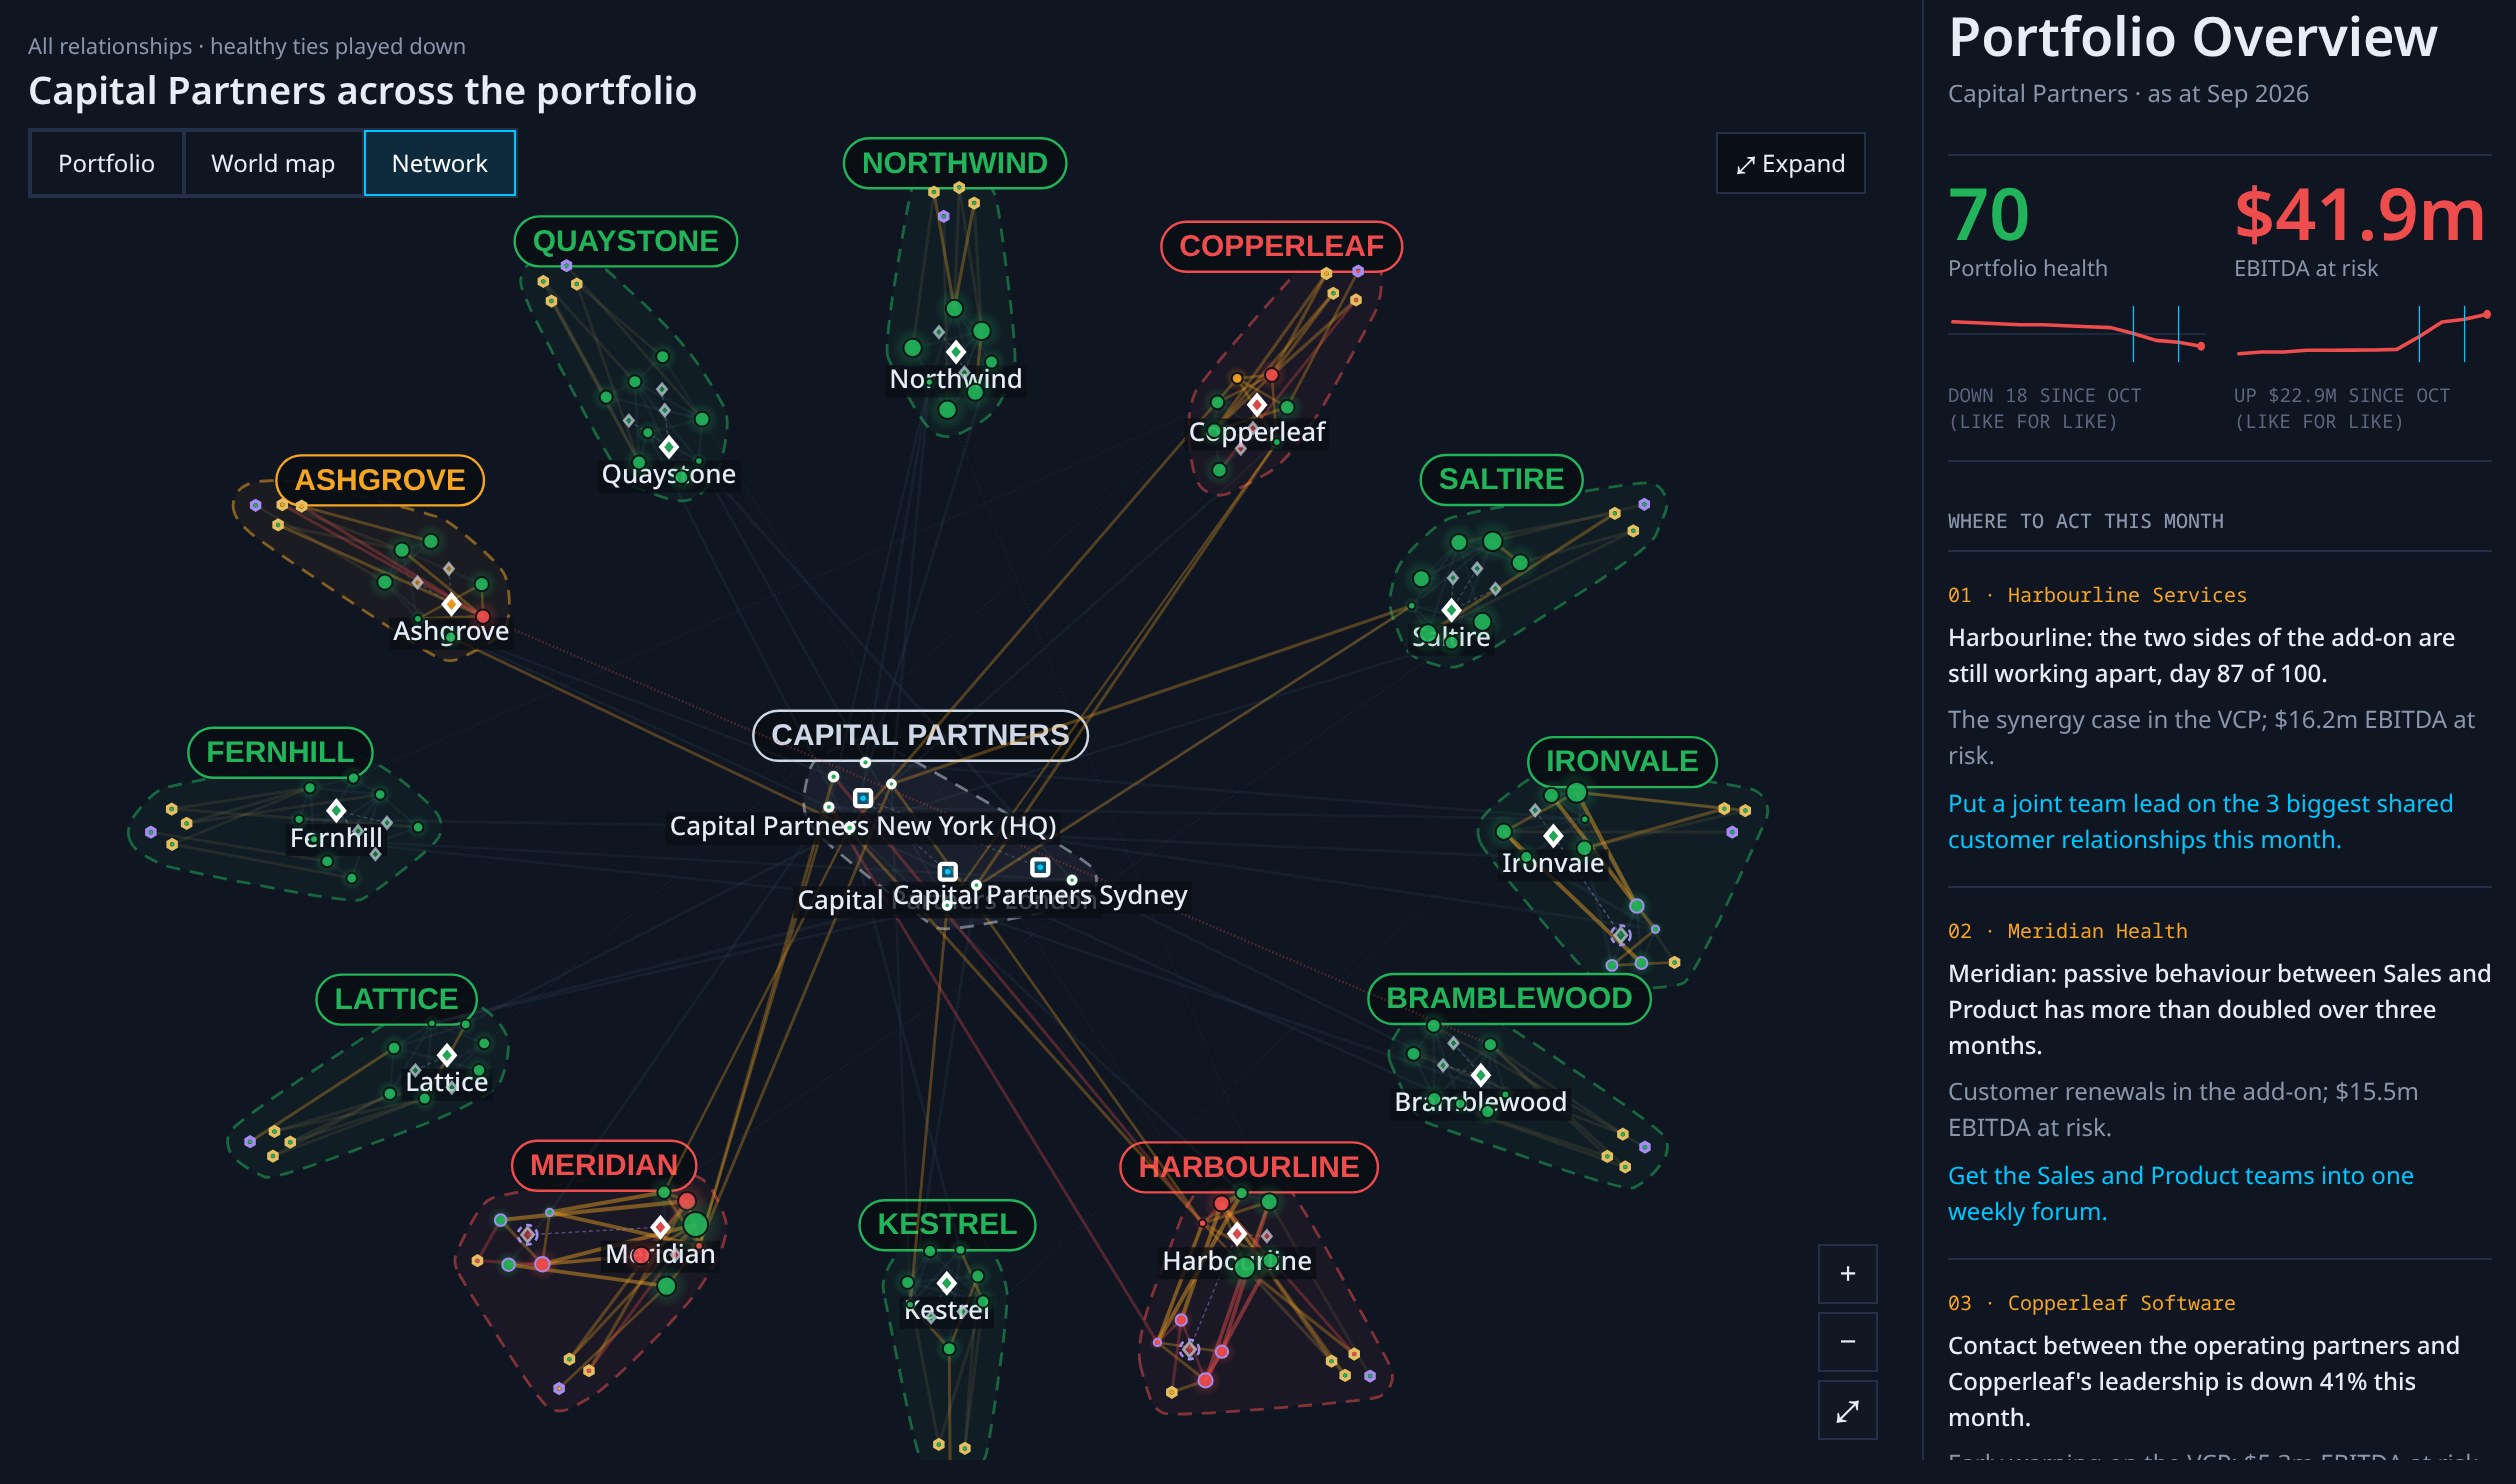
Twelve portfolio companies read the same way, with earnings at risk against the value creation plan.
Open the demo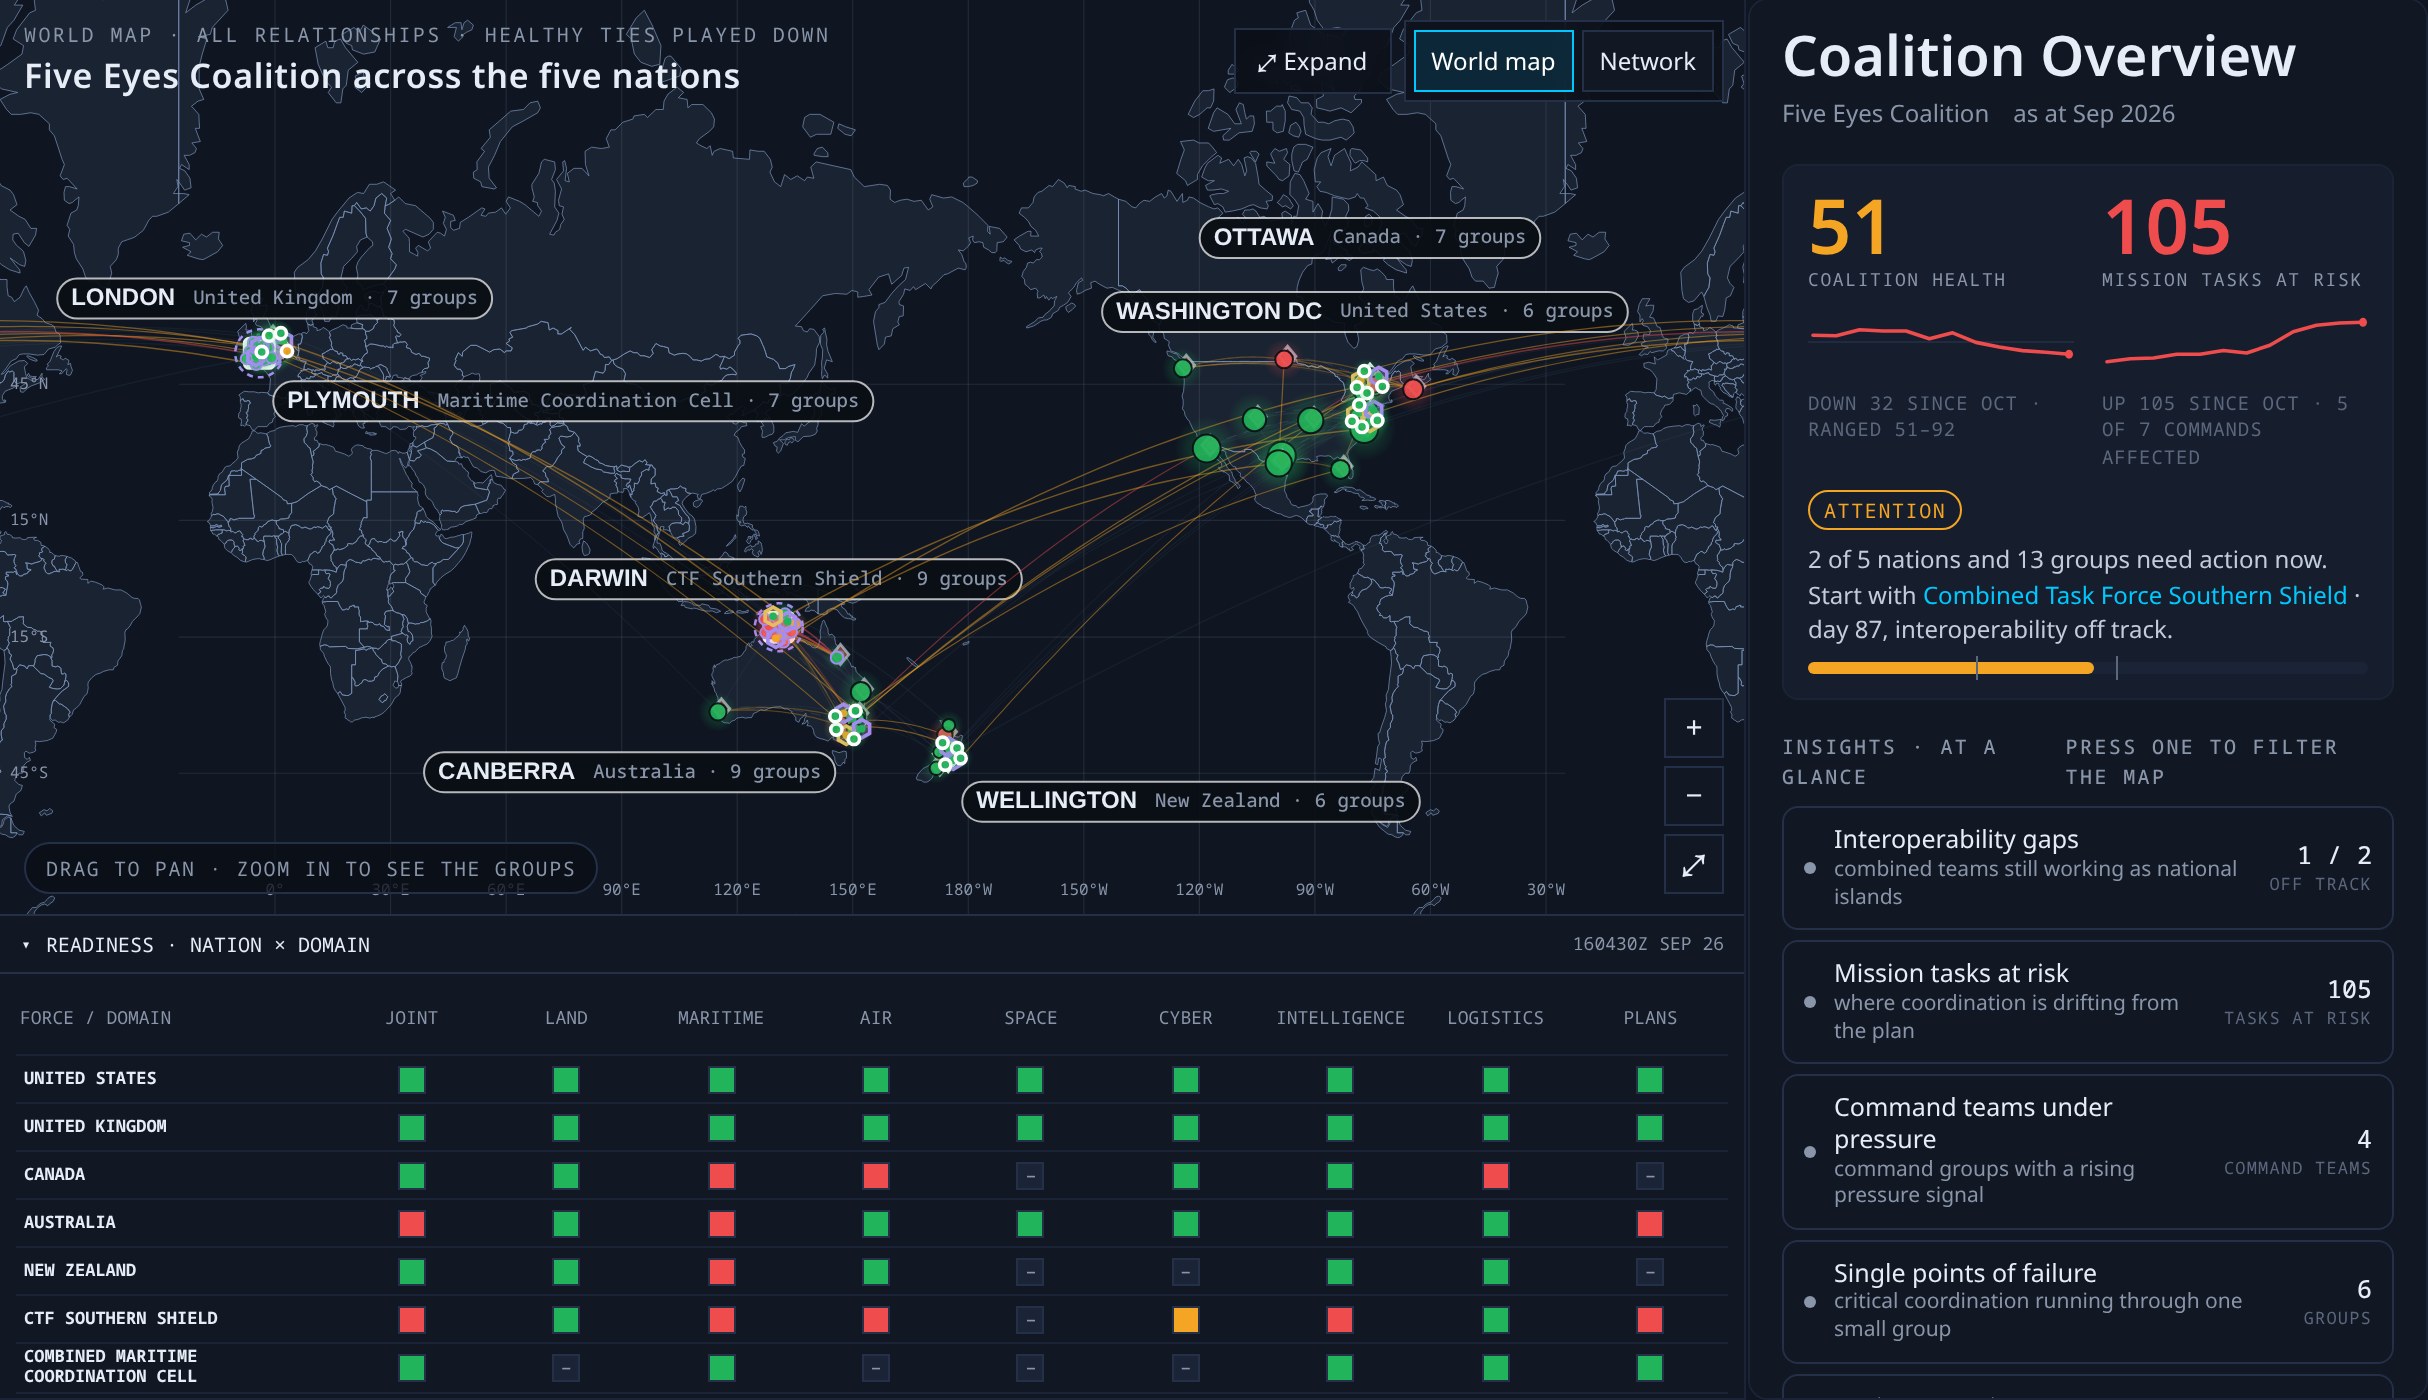
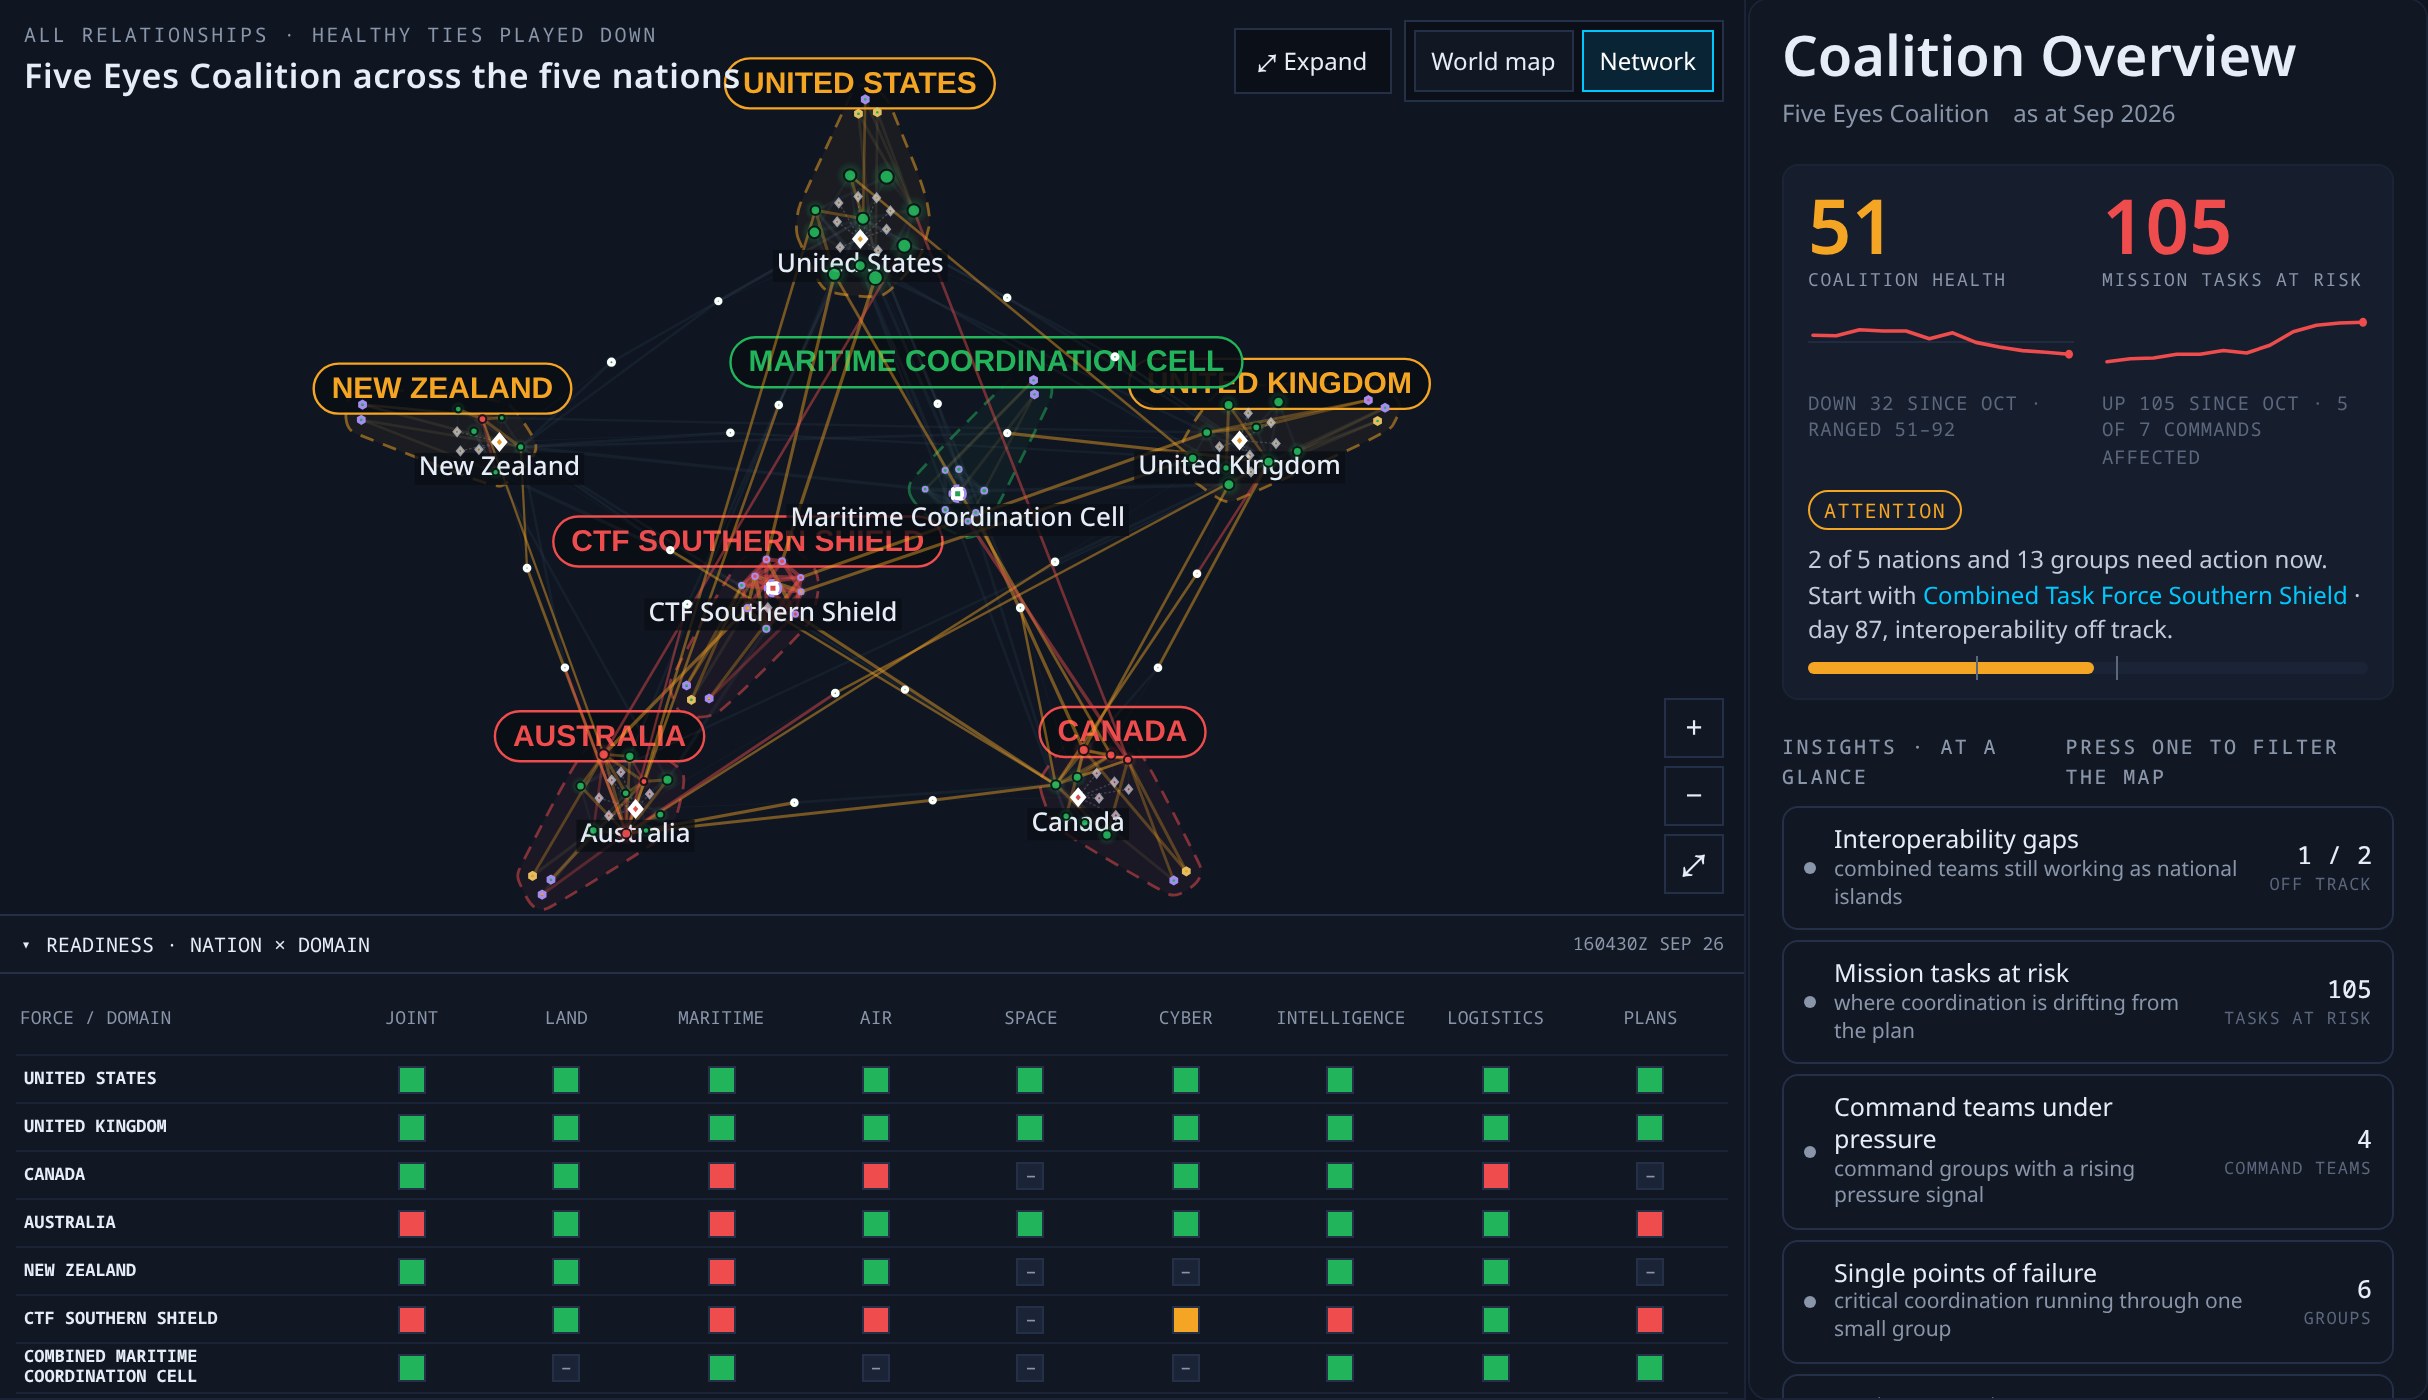
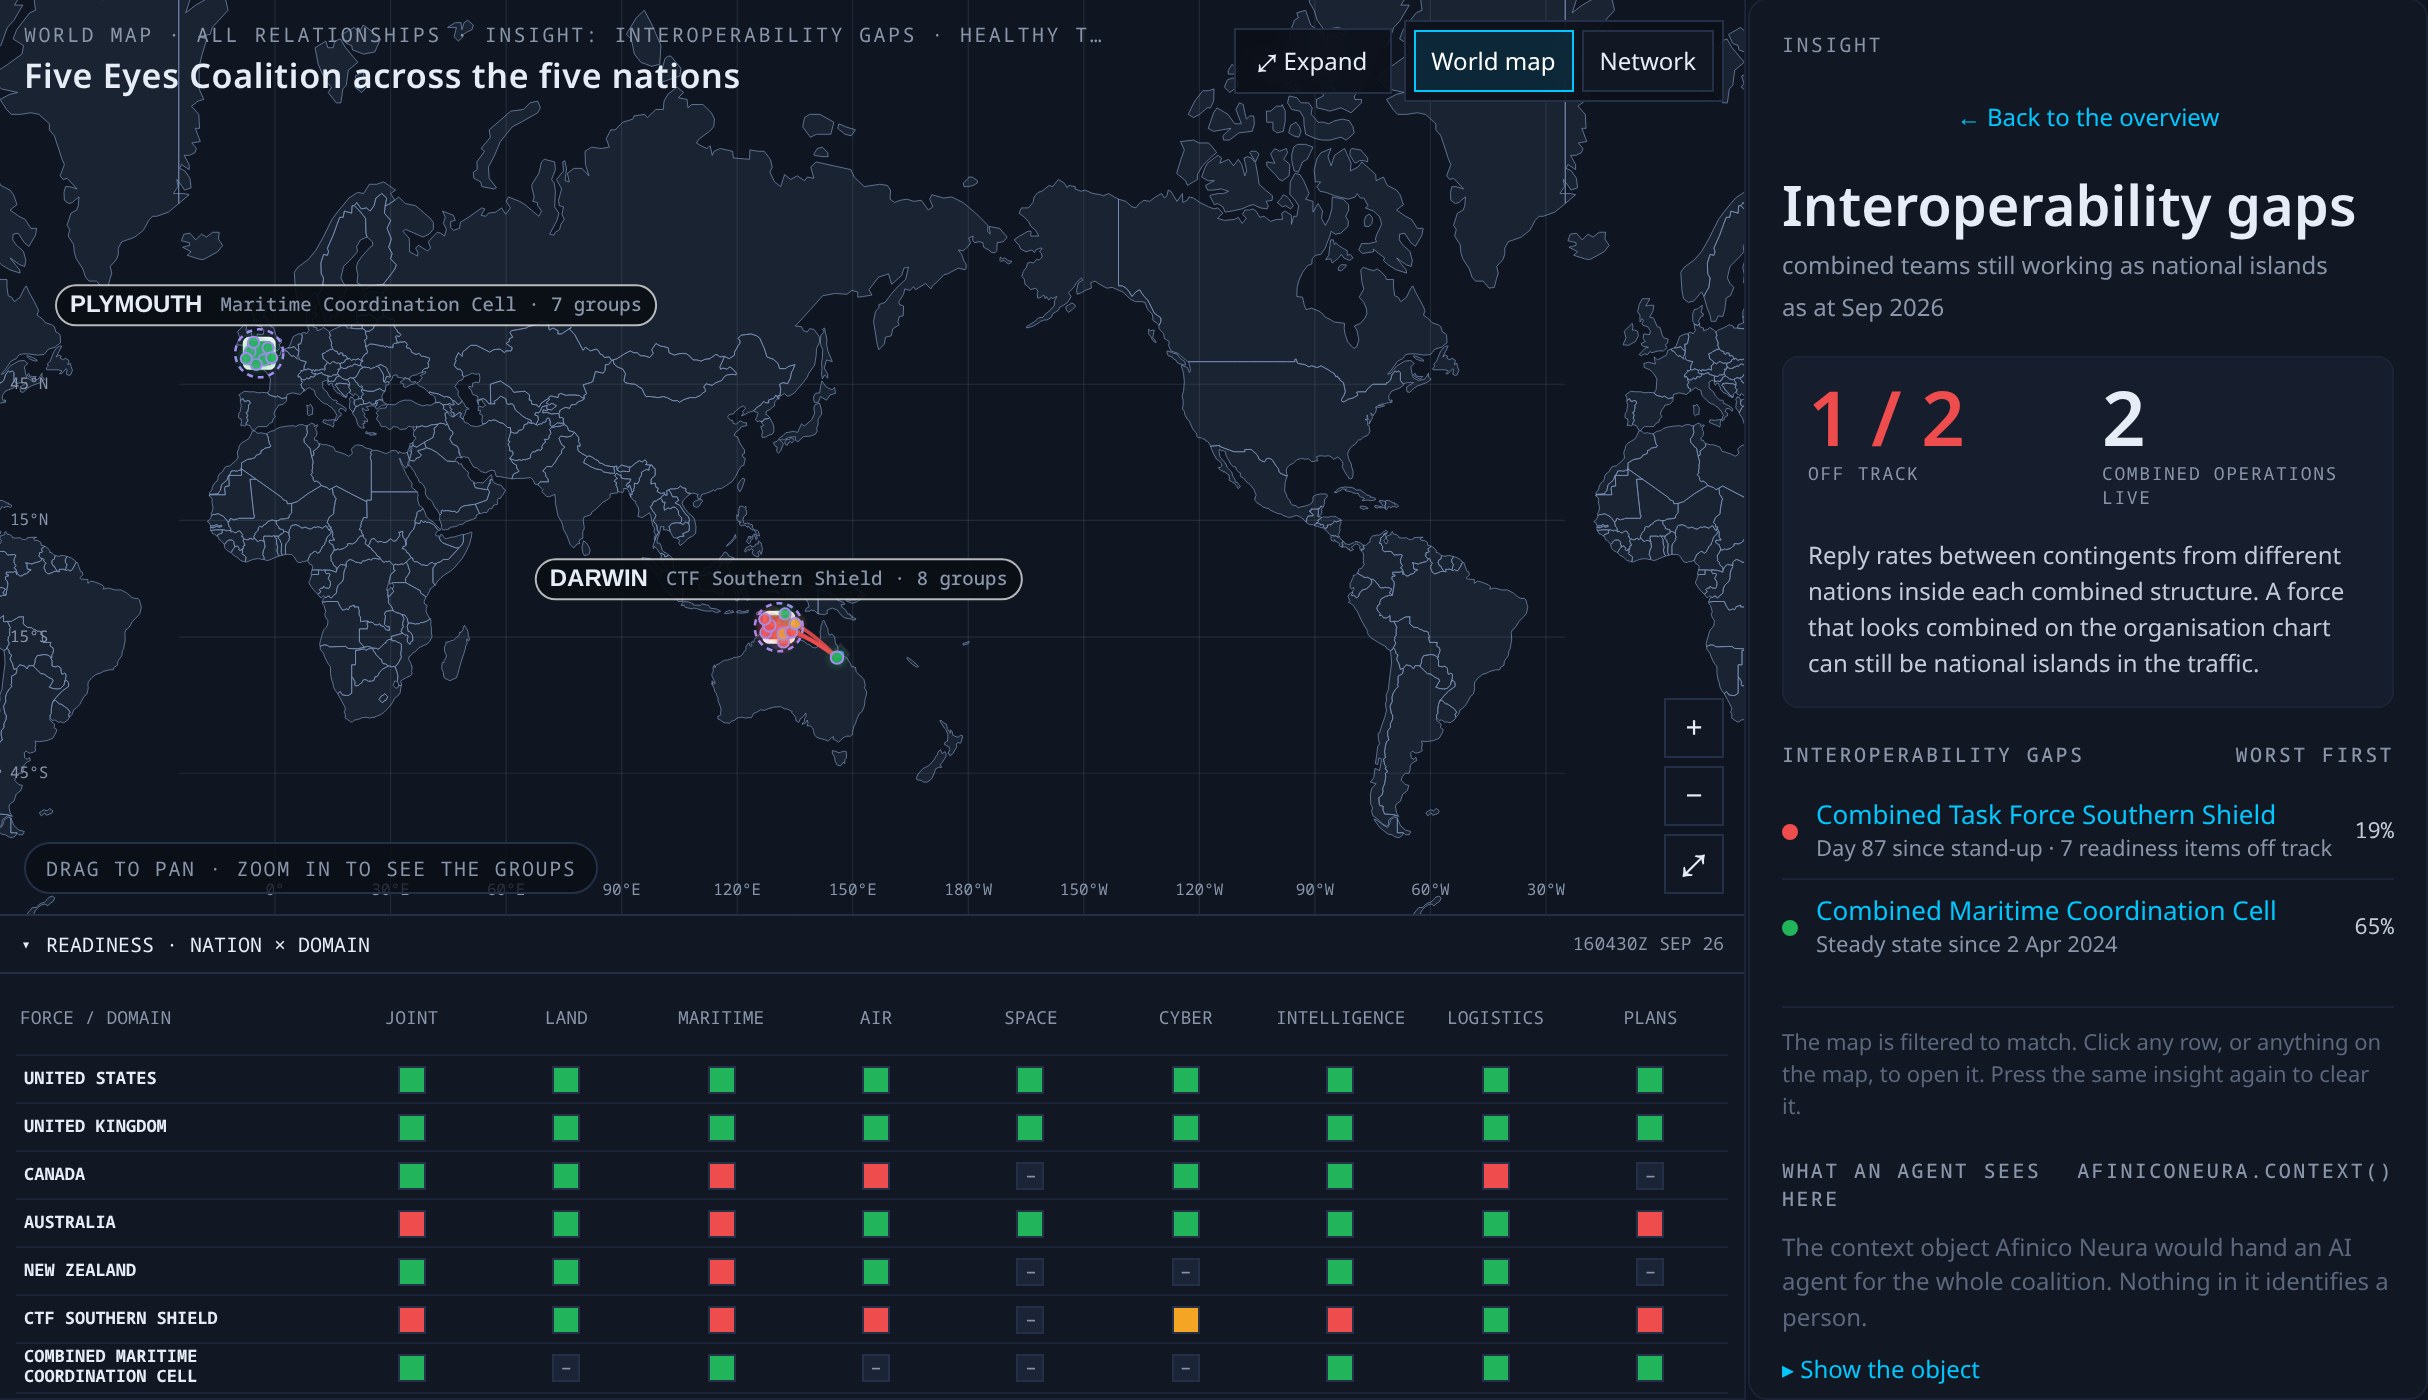
Five nations and fifty-three commands, with mission tasks at risk where coordination is drifting.
Open the demoProtect revenue, profit and enterprise value by acting before the problem shows in reporting.
Try Afinico Neura
Run Afinico Neura in a secure sandbox inside your own environment, using your email and messaging data. Focus it on one client relationship, business or program, and see what it finds.
Day 0-30
Day 30-60
Day 60-90